The app

One place for the whole loop.

Peato turns a peatland field into something you can follow over time: where it is, what it is doing, what you noticed, what you did, and what happened next.

Get the appOpen web app

Fields

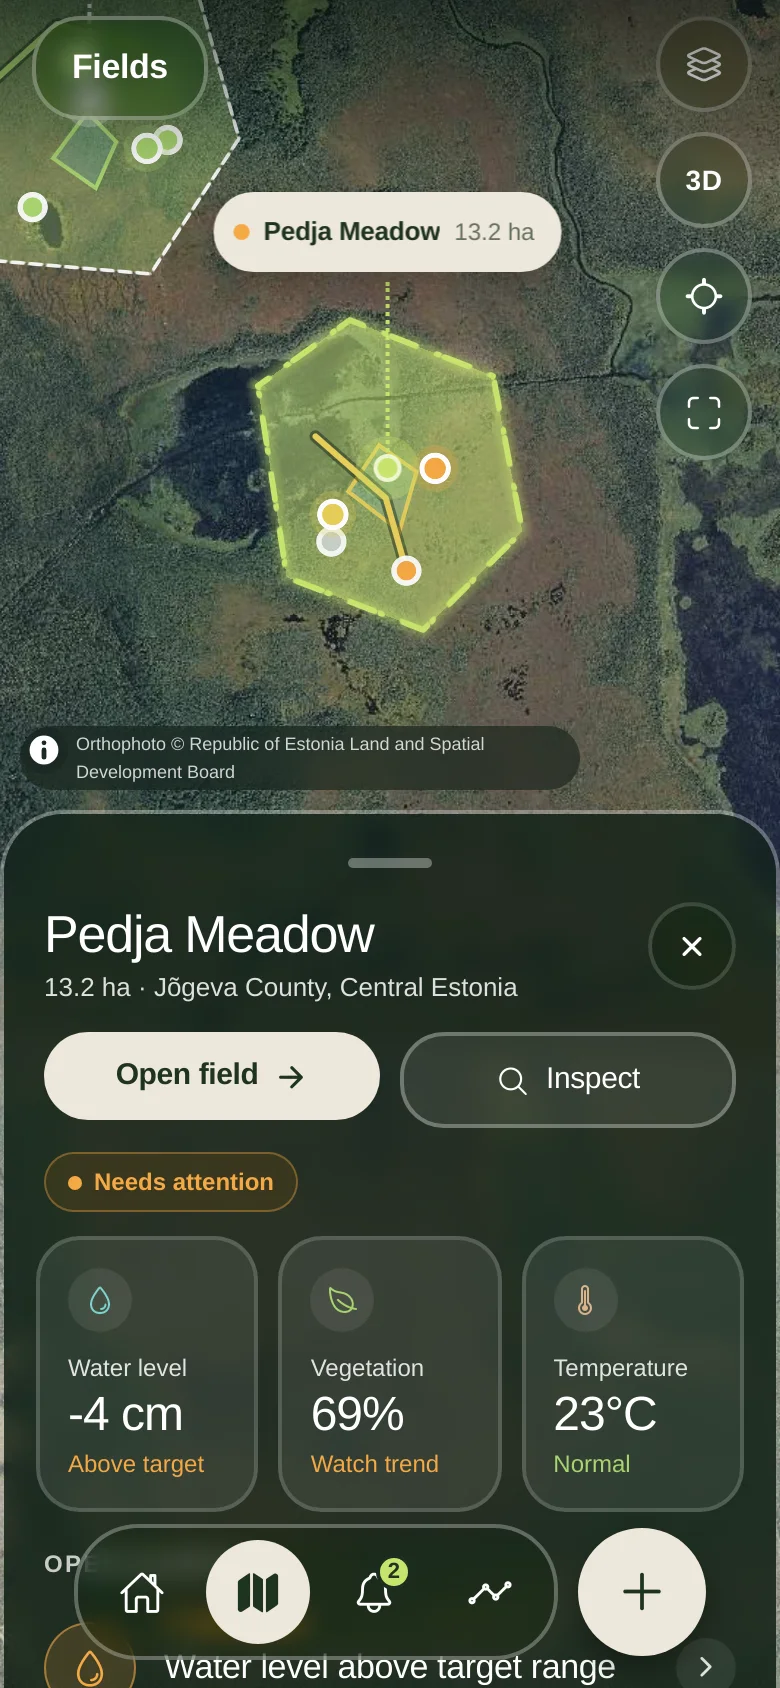
Draw your land on real imagery.

A field is the anchor for everything else. Draw its boundary on official orthophoto where available, or a satellite base map, and every reading, alert and job attaches to it.

  • Draggable vertices, undo, and a live area calculation
  • Checks for self-intersecting shapes and impossible boundaries
  • 3D map, map and list views, fit to field or to all fields
  • A new field starts in Setup, with no invented history
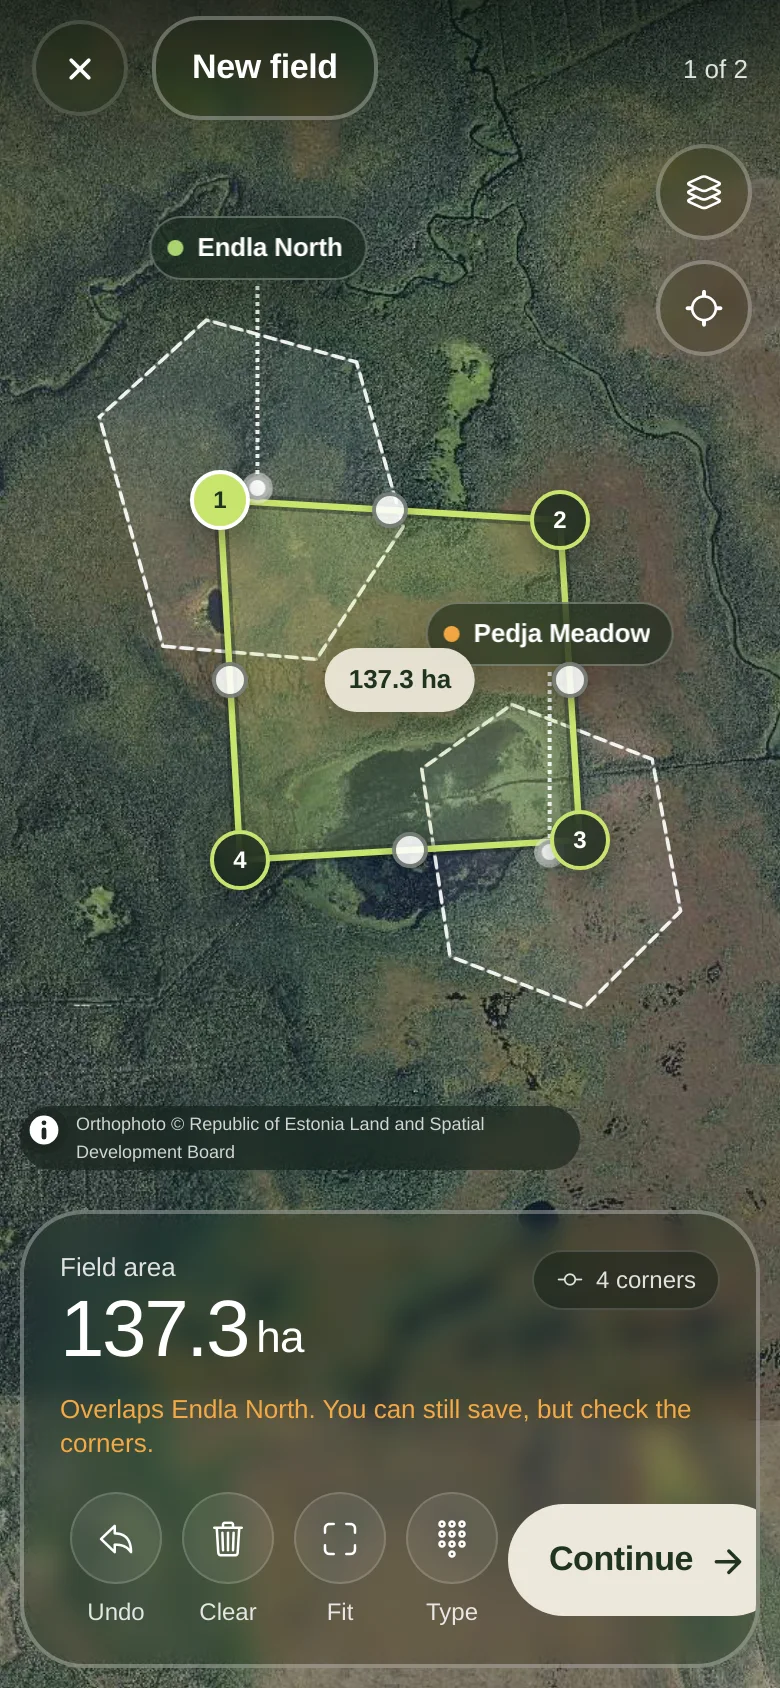
Drawing a field boundary on satellite imagery
A selected field on the map

Insights

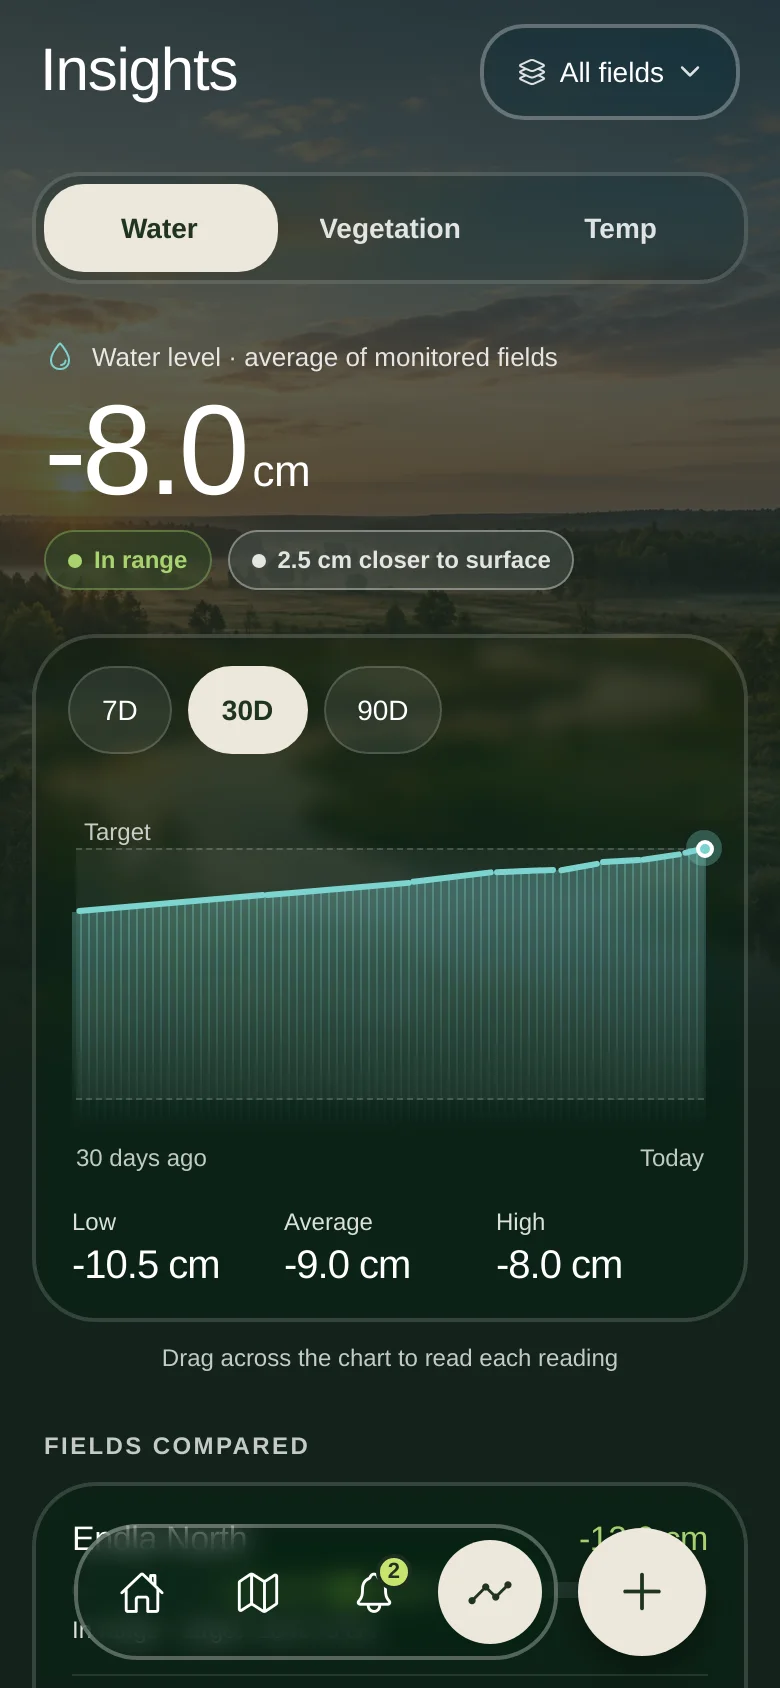
Trends against your own target.

Water, vegetation and temperature over 7, 30 or 90 days, for one field or all of them. The target band is yours, and the chart shows where the reading sits against it.

  • Current, average, low and high at a glance
  • Drag across the chart to read each value
  • Fields compared side by side, with setup and no-data states shown as such
  • Water table always shown as cm below ground
Insights chart

Alerts and activity

Alerts that explain themselves.

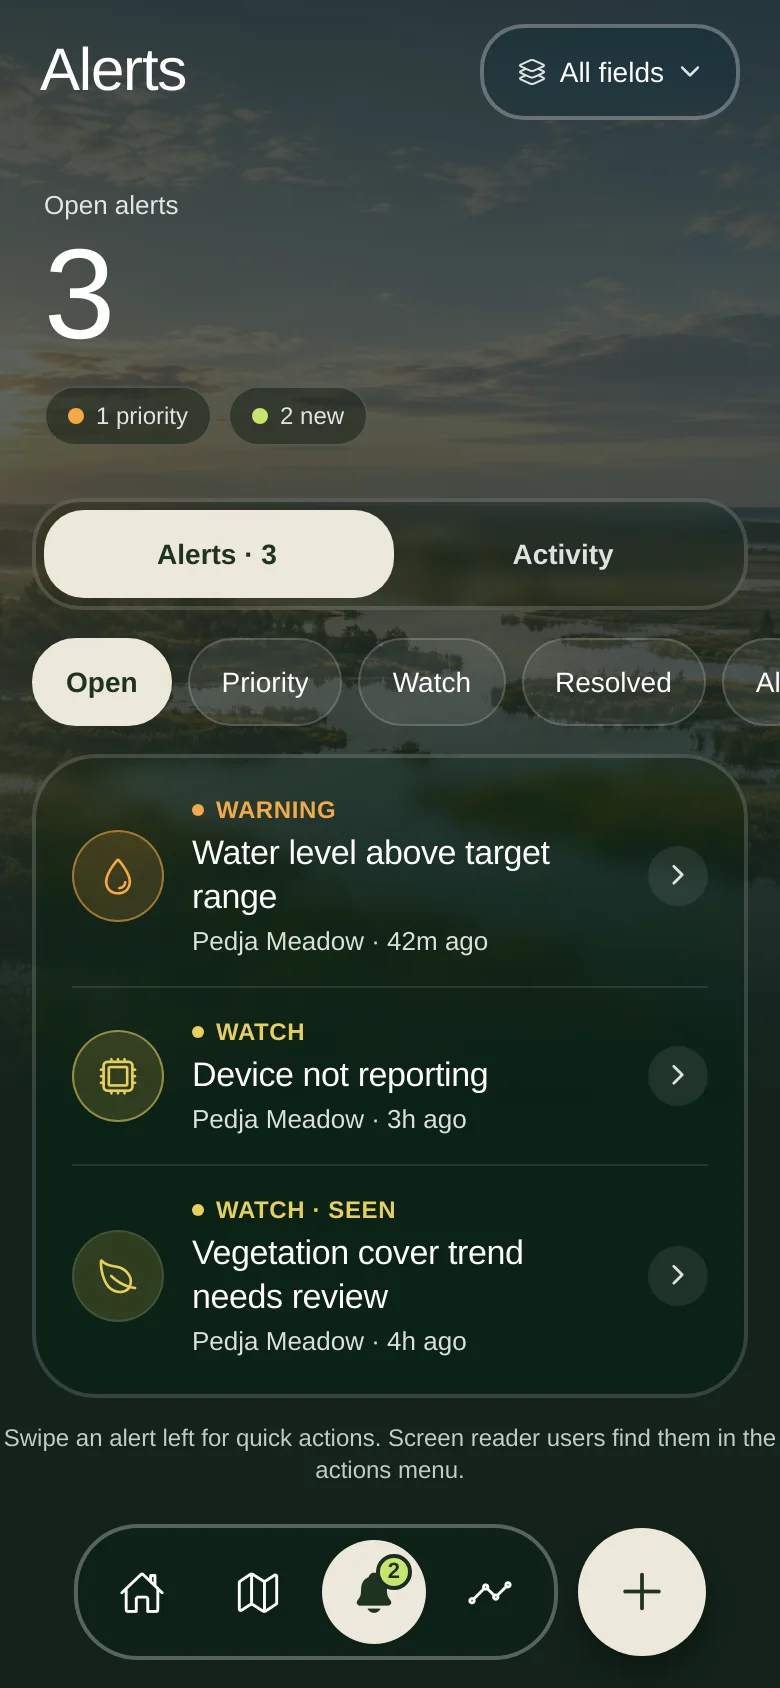
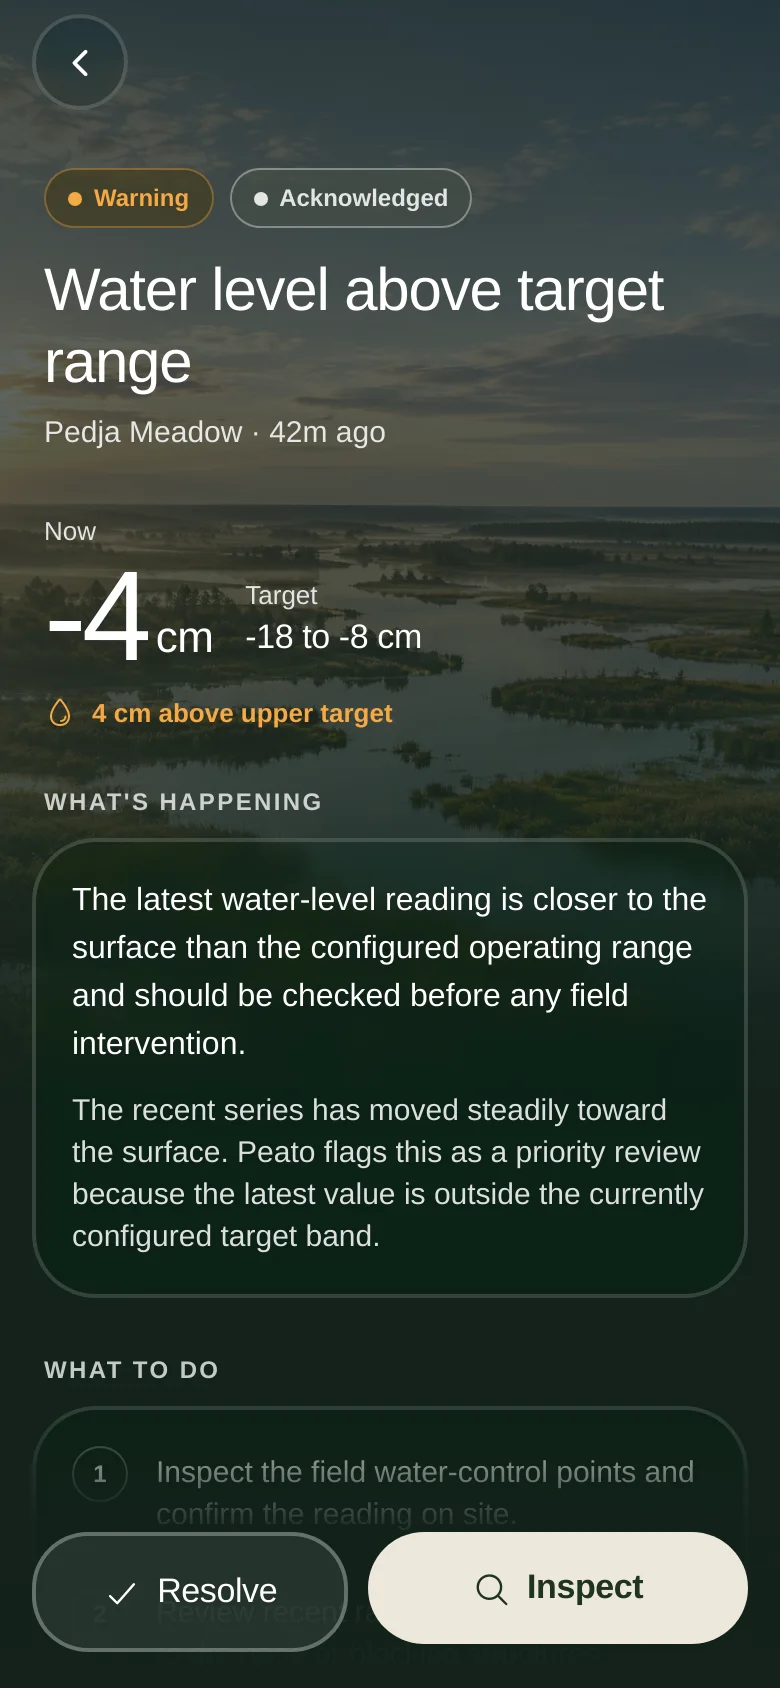
Every Peato alert says exactly why it fired, for example a water level outside the target band you set, or a device that stopped reporting. Each alert says what happened, where, the evidence, and what you can do next.

  • Info, Watch, Warning and Critical, never colour alone
  • Acknowledge, resolve, open the field, or start an inspection
  • One shared activity timeline, so Home and each field tell the same story
  • No prediction and no inferred cause
Alerts list
Alert detail

Inspect and act

The visit and the job, written down.

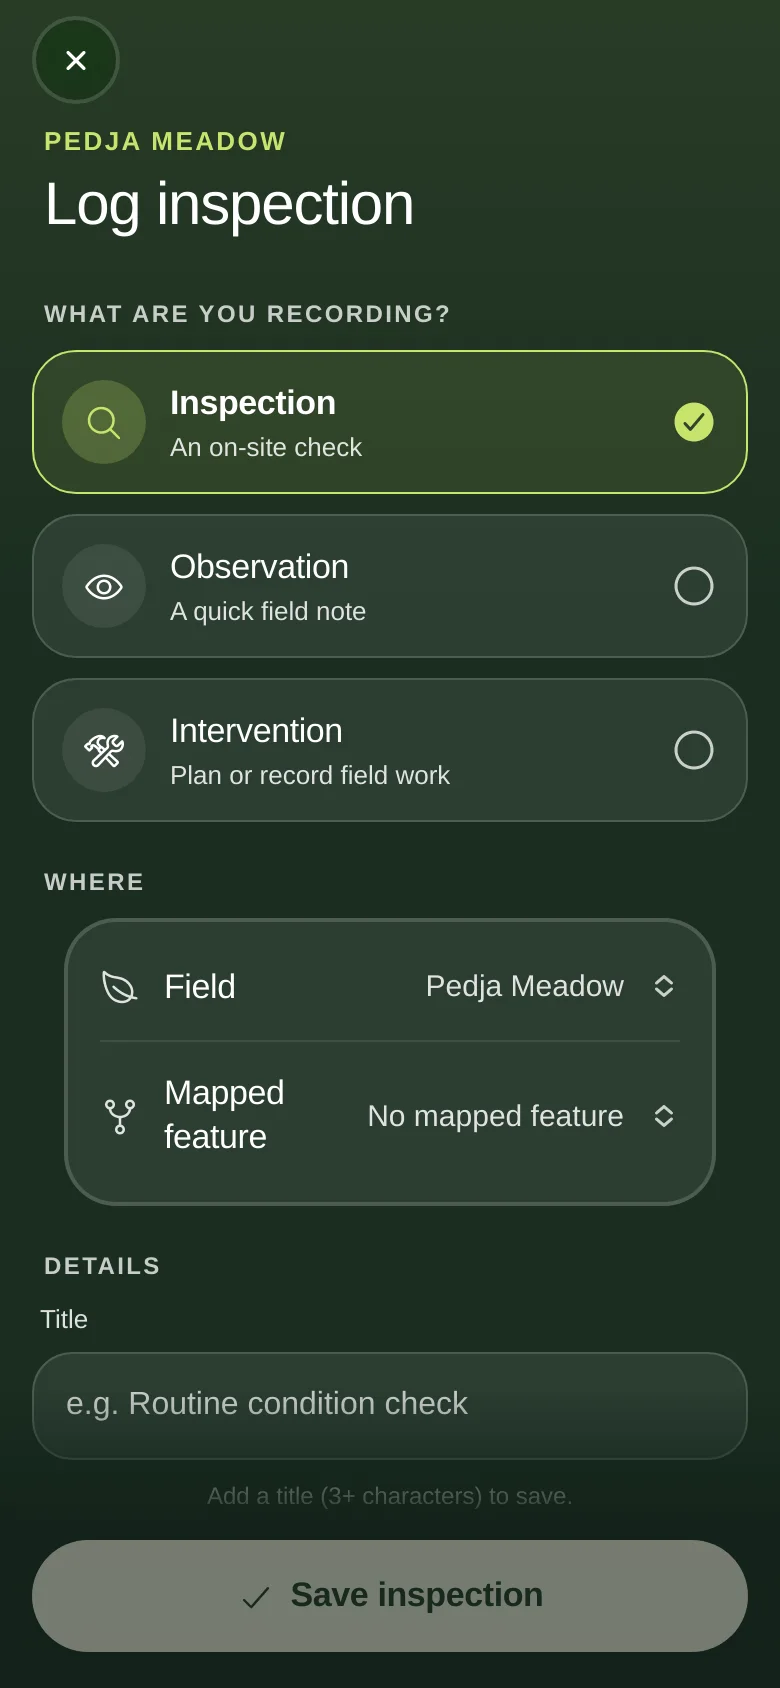
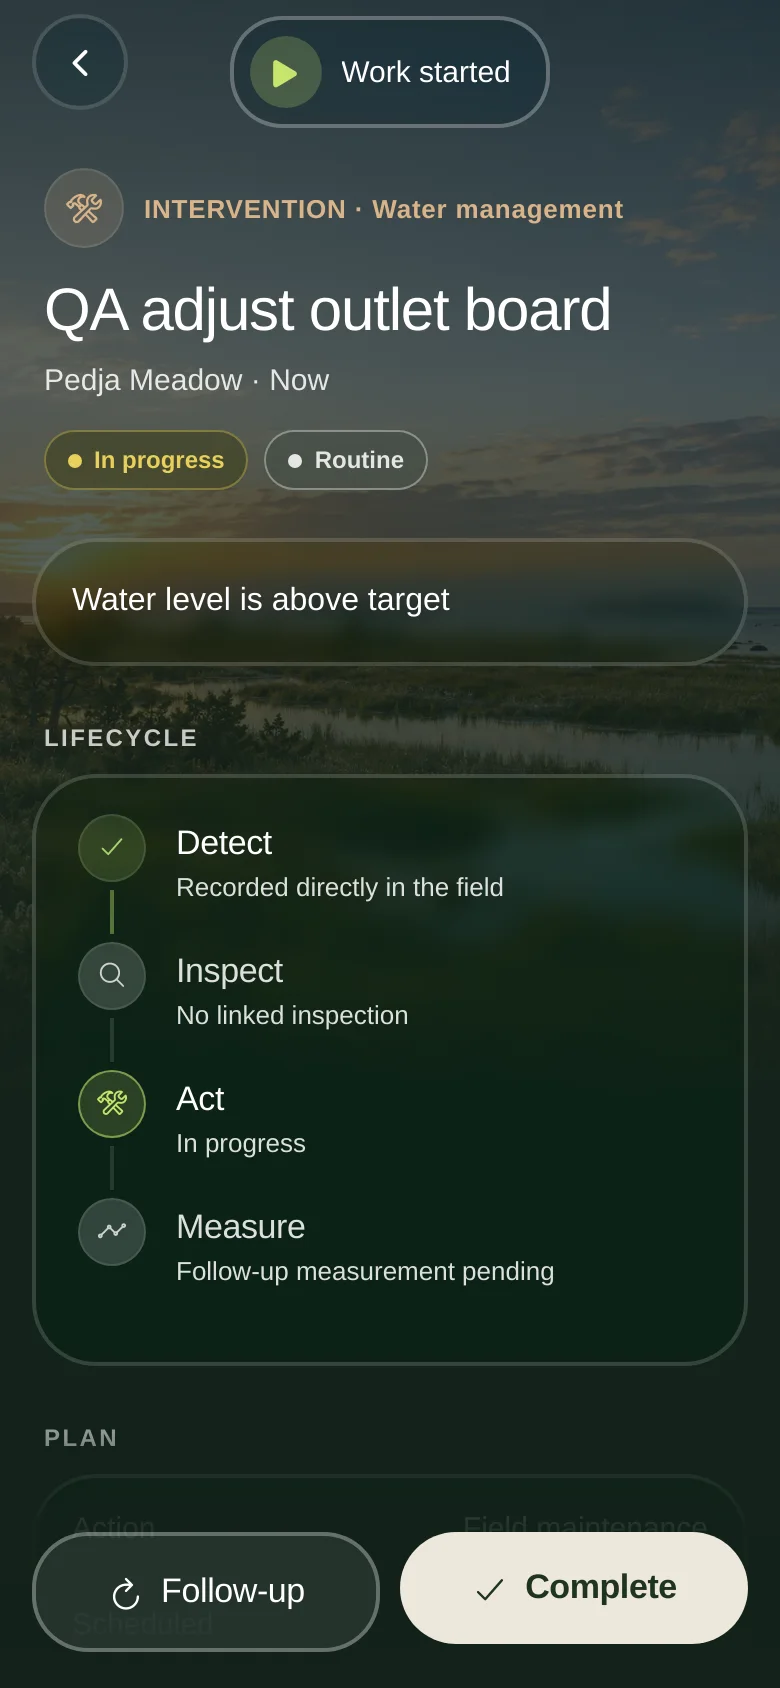
Log an inspection with what you saw, then plan the intervention it calls for: a reason, an expected outcome, a priority and a follow-up date. Start it, complete it, and keep the trail.

  • Water, vegetation and infrastructure conditions in a few taps
  • Planned, in progress, completed, needs follow-up
  • Linked to the alert that started it and to the field it happened on
Log inspection
Intervention in progress

Measure

Close the loop with a number.

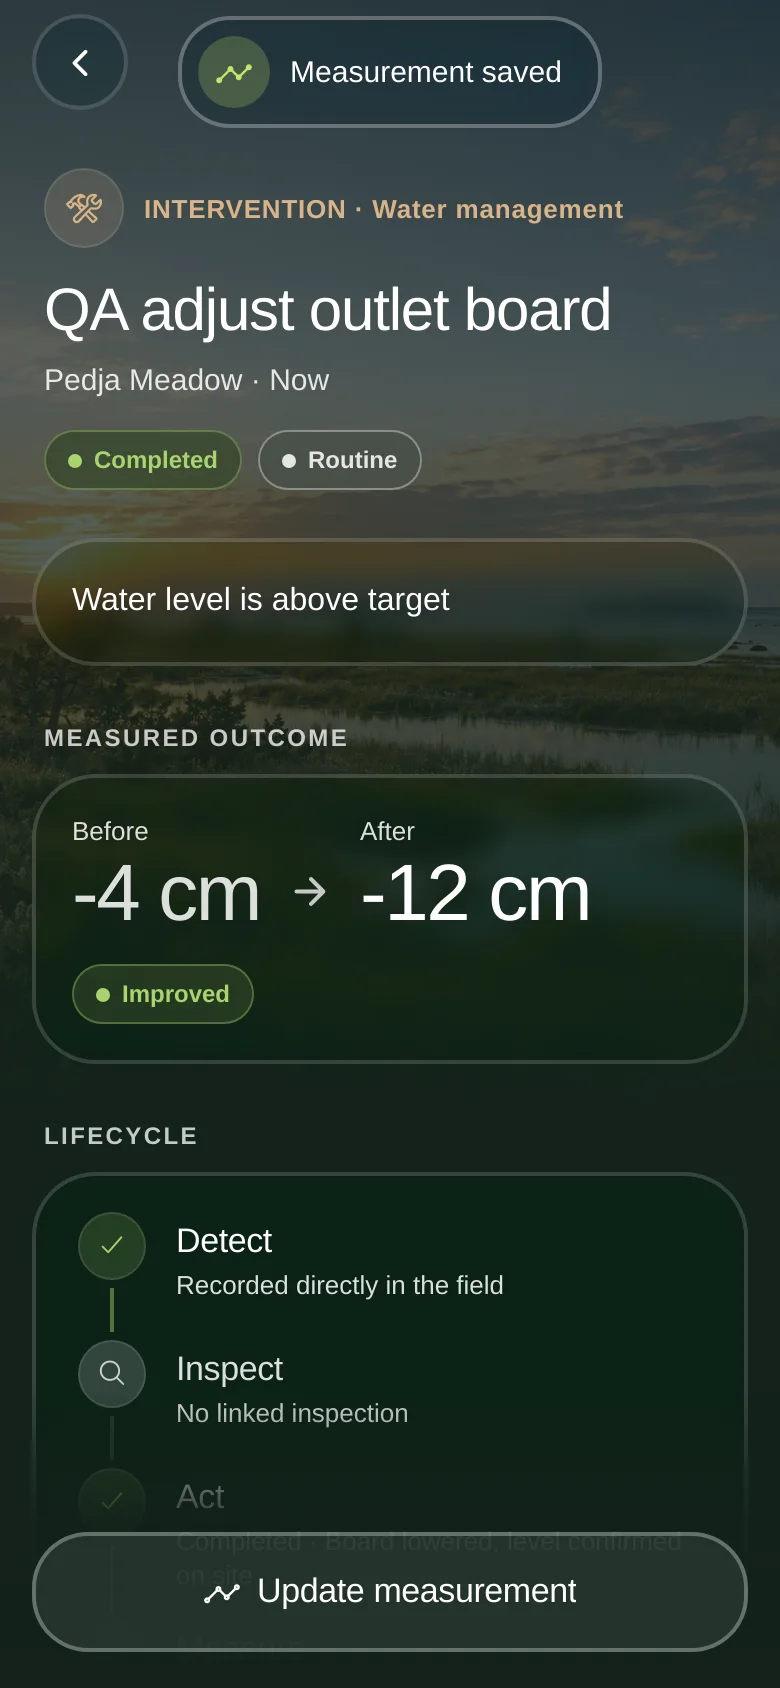
After the work, record the reading again. Peato shows before, after and target together, and lets you mark the trend as improved, stable or needing attention. It records what changed. Whether the work caused it is a separate question, and the app keeps them apart.

  • Before and after on the same scale
  • What next: target restored, or continue monitoring
Measured outcome

Monitoring and devices

Pair a device. Place it on the map.

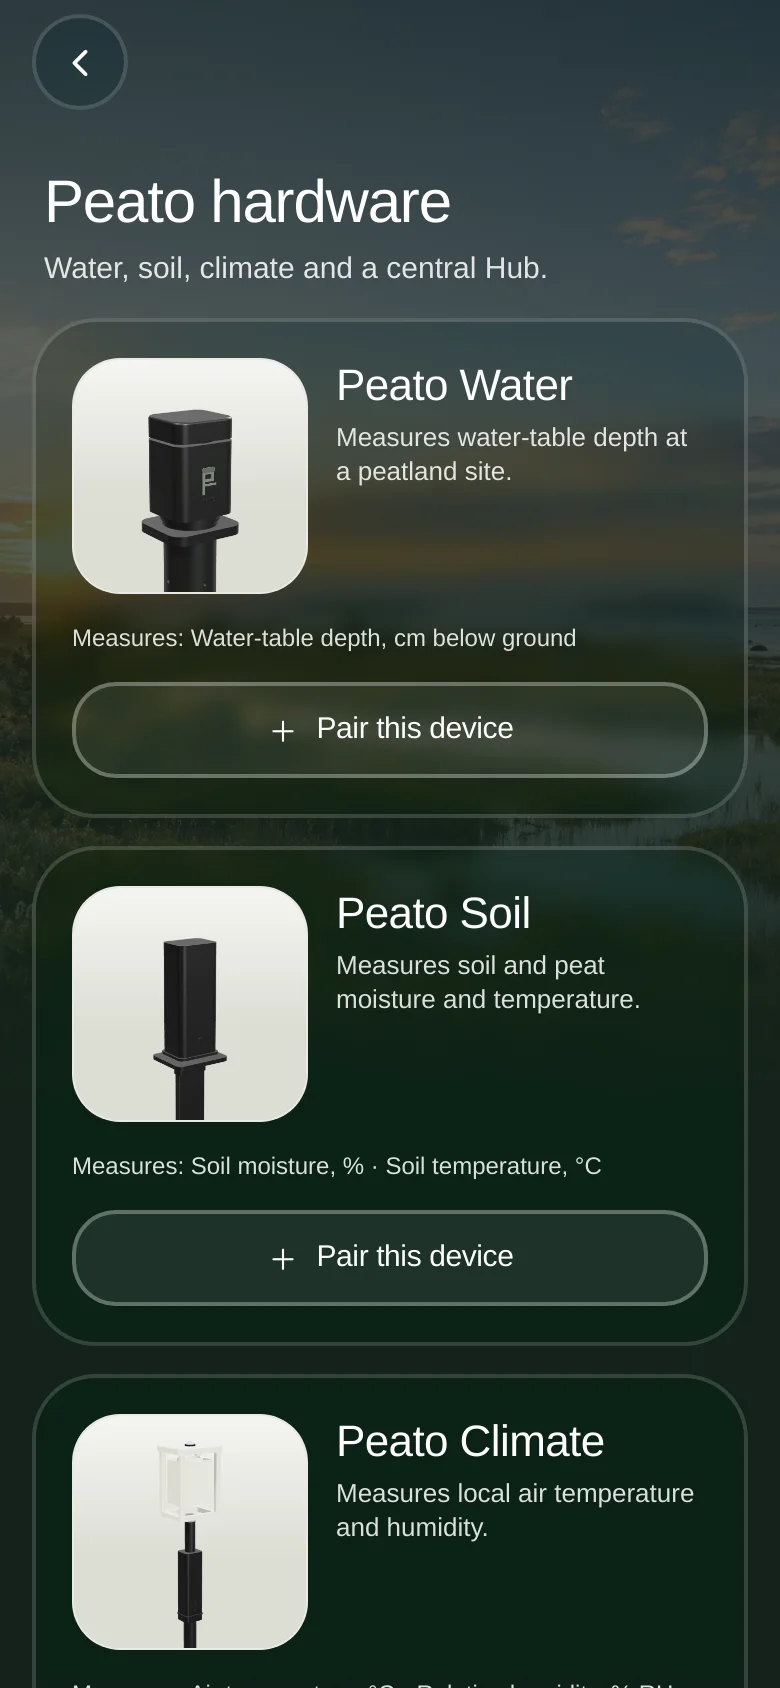
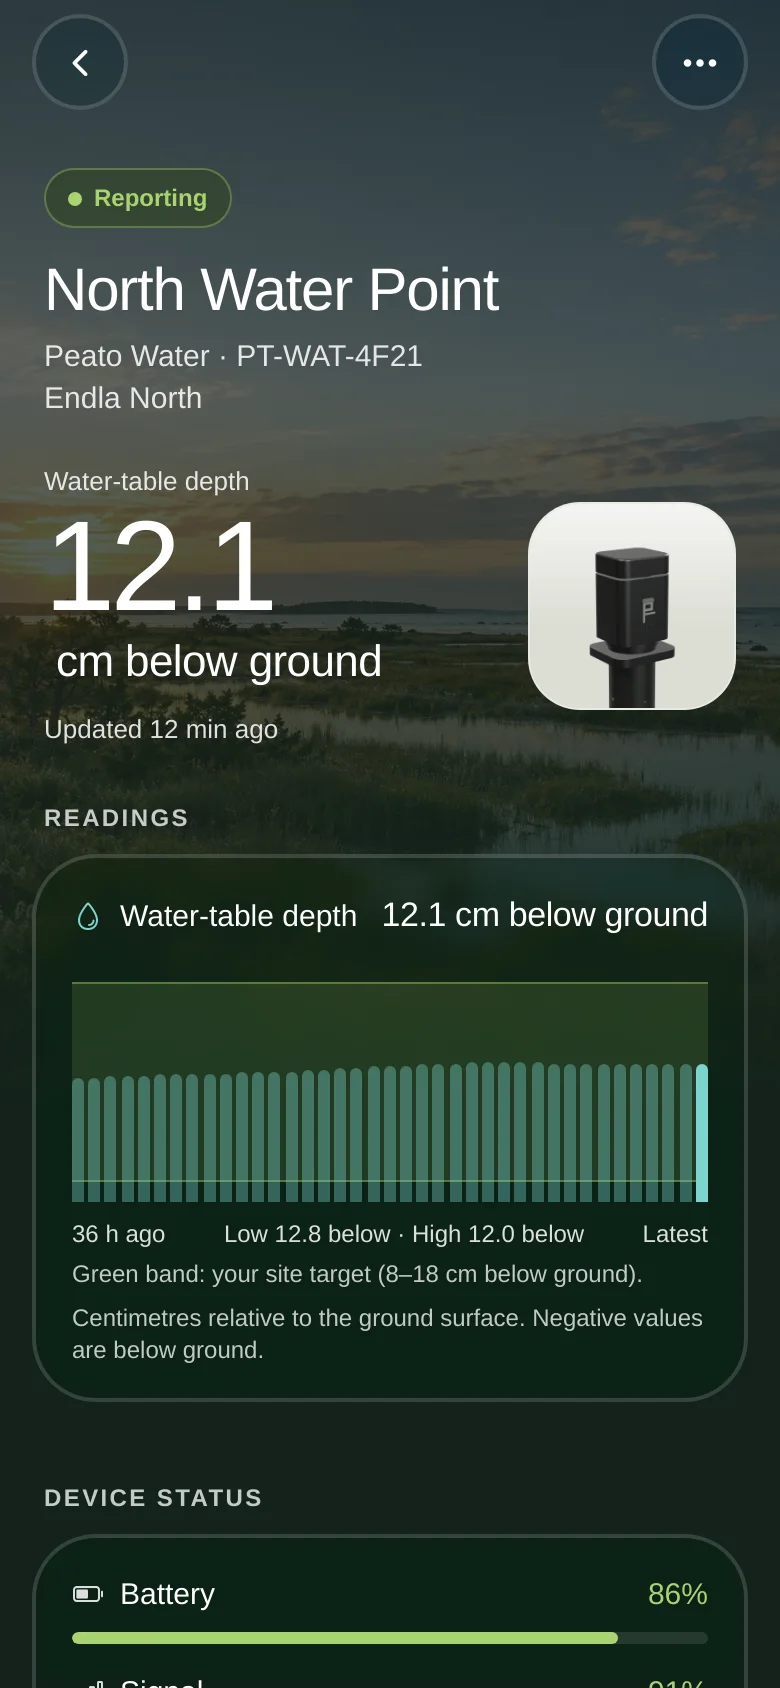
The whole device flow is in the app: choose a field, pick a device, identify it, name it and place it on the map.

  • Reporting interval, battery and signal on every device screen
  • Clear error states: not found, wrong type, already registered, interrupted
  • Each device is tied to one field and one point

See the hardware

Peato hardware list in the app
A Peato device

Reports

A record you can hand to someone.

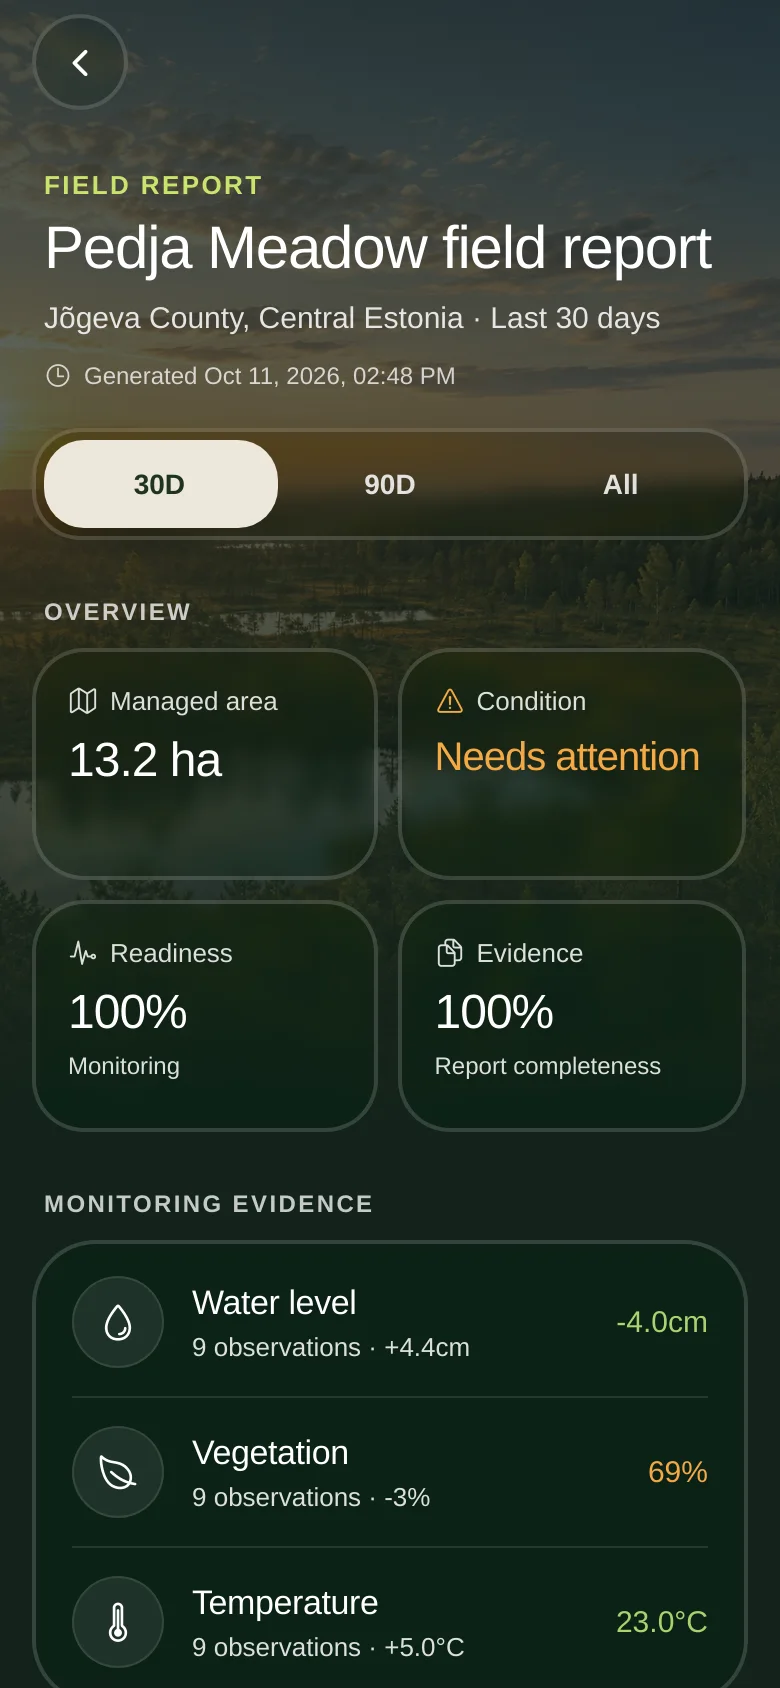
Field, workspace and intervention reports state the period, the scope, the sources and the limits.

  • 30, 90 day and all-time views
  • Monitoring evidence listed per variable, with how many observations back it
Field report

Languages

Nine languages.

The whole app, including dates, numbers and plurals, follows your language. It follows your phone by default and you can change it any time.

🇪🇪 Eesti🇬🇧 English🇫🇮 Suomi🇸🇪 Svenska🇩🇪 Deutsch🇵🇱 Polski🇱🇻 Latviešu🇱🇹 Lietuvių🇳🇱 Nederlands

See it on your phone.